
![]()
Designed and published by: Vassilis Serasidis
|
|
|
|
Features |
||
|
Introduction
A few months ago as I was surfing on the net, I saw an oscilloscope based on PIC18F2550 microcontroller and a KS0108 controller based graphical LCD. That was Steven Cholewiak's web site. I had never seen before so amazing microcontroller-only oscilloscope. That was realy impressive circuit, so I decided to design something like that but in C language instead of assembly that I was using all those years. The best solution for me was the WinAVR as it bases on open source AVR-GNU compiler and it works perfect with AVR studio 4. The graphics library that I used, was made by me specific for this project. It's not for general use. If you want to include it to your source codes, you have to convert it according to your needs. The maximum input signal speed who can show up this oscilloscope is 7.7 kHz in square signal. For other signals (sine or triangle) the frequency is lower ( almost 1 kHz) for having clear view of the signal.
Schematic of the circuit (click to enlarge)
Description
The operating voltage of the circuit is 12V DC. By this voltage, the power supply is producing 2 voltages. +8.2V for IC1 and +5V for IC2 and IC3. This circuit can measure from +2.5V to -2.5V or from 0 to +5V dependent by S1 position (AC or DC input). By using probe with 1:10 division you can measure almost 10 times higher voltages. Moreover, with S2 you can make an extra division by 2 the input voltage.
How the software triggering works
As you can see the circuit doesn't have any hardware triggering. The triggering function is been made entire in software.
- The AVR gets up to 15000 Analog to Digital Converter samples and calculates the middle value of the waveform. The number of captured samples is depended on when a full period is completed
- Starts again capturing new samples but every sample value must be compared with the previous sample.
- If the next sample is higher than the previous sample then our waveform is rising. So AVR goes to step 4. If the next sample value is lower than the previous sample then AVR goes to step 2.
- Read the next sample value and compare it with the middle value had been calculated in step 1.
- AVR checks if the value of the next captured sample is higher than the middle value.
- If it's higher, the beginning of the waveform has been found. The AVR starts capturing the next 100 samples in to the RAM. I choose 100 samples because I left 100 pixels on LCD for displaying the waveform.
- AVR Prints these 100 samples on LCD.
- AVR starts again from step 1.
The steps for triggering are:
You will say: Why AVR starts again from step 1 and not from step 2 ? AVR starts again the capturing from step 1 because you can change the peak-to-peak voltage of the waveform (0V - 5V). Changing the input waveform will change the middle value of the waveform.
How is the frequency is calculated
The frequency indication of course is not very accurate. The calculation is been made by counting the time from the beginning of waveform (step 4 in "How the software triggering works") until the next start of waveform.
Programming The ATmega32
Burn the ATmega32 with AVR_oscilloscope.hex and select external crystal at the fuses section.
After that, you Must disable the JTAG interface from your ATmega32 microController. If you don't do that, the mega32 will show you the initial screen and when it go to the oscilloscope screen it will restart immediately to the initial screen and it will stay there for ever.
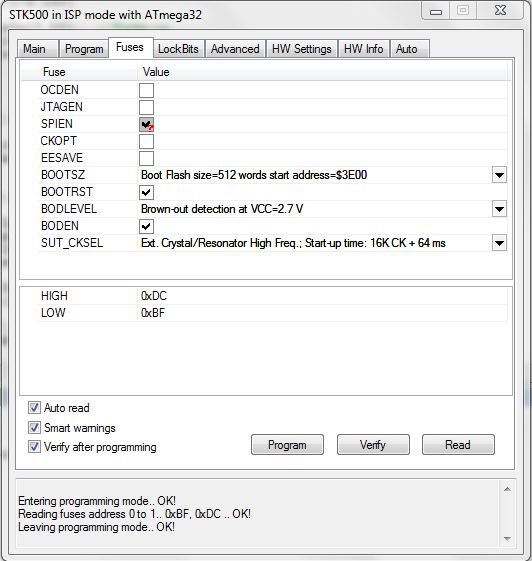
The fuses that must be set in ATmega32 microcontroller.
Calibrations
The only 2 things you have to calibrate is the LCD contrast trimmer P2 and the P1, to move the beam at the center of the LCD. To do that, apply only the power supply to the circuit and adjust the P2 up to the point you will see clear the appeared pixels on the screen. Then, adjust the P1 up to the point the beam is moved at the middle of the LCD (at the horizontal line of the cross).
Usage
You can move the beam up or down the screen by pressing the buttons S8 or S4 correspondingly to measure the voltage of the signal. 1 volt is taking up 1 square height.
With S7 and S3 you can increase or decrease the measurement speed. The minimum speed of a waveform that can be displayed on LCD is 460Hz. If you want to view a lower frequency waveform, for example 30 Hz, you can press the S7 to shrink the waveform or S3 to extend the waveform up to the maximum sampling rate.
This oscilloscope has an automatic trigger. That means, if you have a continuous signal (ex a triagle waveform) the auto trigger will work perfect. If your signal is not stable (ex a serial transmittion) you can freeze the screen by pressing S6 switch. At his case you can get a snapshoot of your measurment signal. By the time you release the S6, the snapshoot will end.
|
|
|
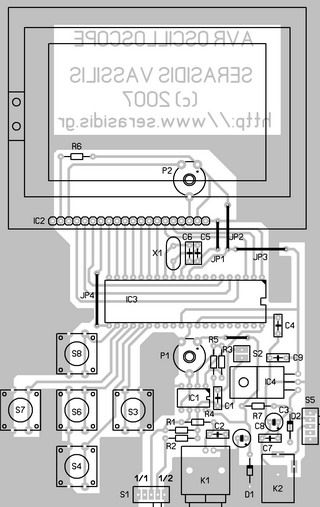
PCB (101x160mm) and components placement.
History:
-- (19 Mar 2011) V2.00 by Vassilis Serasidis. The harware (PCB, schematic diagram, electronic components) remains the same.
-
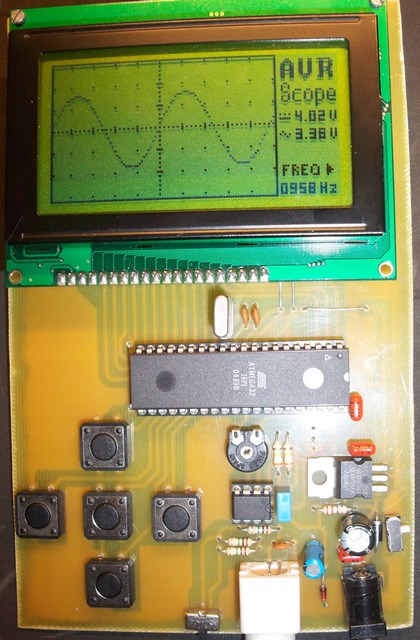
Information about the measured waveform has been added on LCD. Now you can see the Volts peak-to-peak, Volts DC and the frequency of the measured waveform.
-
The RAM requirement of AVR microcontroller has been reduced from 2kB to 335 bytes! Now you can slightly modify the source code for migrating on another AVR microcontroller with (probably) higher ADC (Analog to Digital Convertion) capabilities.
-
Improved the sampling rate. Tha sampling accuracy was reduced from 10-bit to 8-bit and the ADC prescaller decreased from 16 to 4. These changes give higher sampling rate.
-
A problem with buttons S3 and S7 was fixed. Now these buttons work properly.
-- (26.Jun.2008) V1.01 by Anantha Narayanan. Fixed a problem that was showed up the with the delay routine and optimitation flags.
-- (03.Aug.2007) V1.00 Initial version by Vassilis Serasidis.
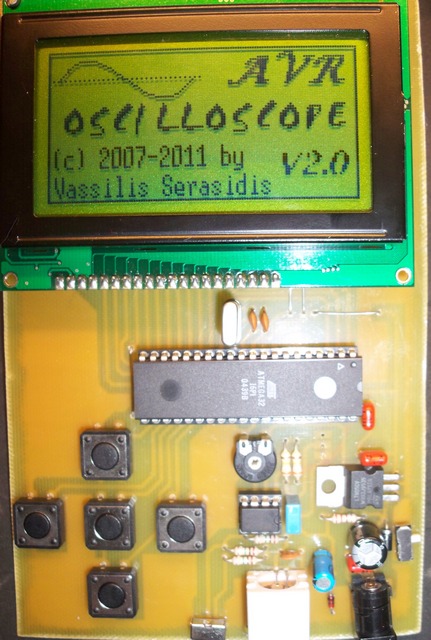
AVR oscilloscope V2.00 in action.
|
|
V2.00 Download the source code and the hex file of AVR oscilloscope. |
|
|
V1.01 Download the source code and the hex file of AVR oscilloscope. |
|
|
V1.00 Download the source code, hex, schematic and PCB of AVR oscilloscope. |
|
|
Software to make your own 128x64 pixel logos for graphical LCDs . |
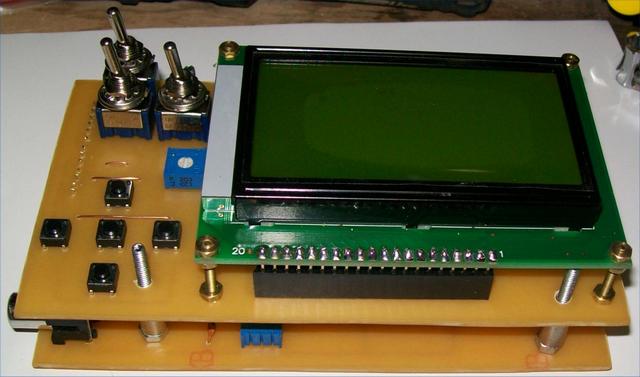
The implementation of AVR oscilloscope by Leonardo Chocron. He drew his own PCB (sandwich).
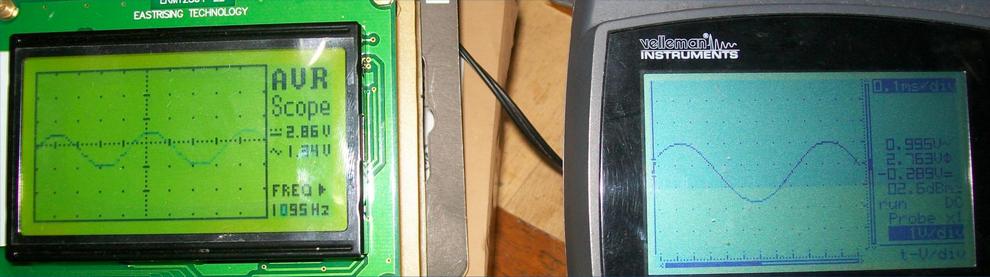
A comparison between "AVR oscilloscope" and Velleman oscilloscope. Yeah... there are some differencies on voltage indication.
Created and published by Vassilis Serasidis on 01.Dec.2007
Updated by Vassilis Serasidis on 01.Jun.2011